The Benchmark War Is a Menu, Not a Scoreboard
When two frontier labs both claim to win, read the tables they didn't put in the headline — and then go build your own eval.
The Benchmark War Is a Menu, Not a Scoreboard
Both labs won. Read that sentence again.
Open two tabs on July 12, 2026: Anthropic’s Fable 5 and OpenAI’s GPT-5.6 Sol. Both pages say they took the crown. Not “competitive with.” Won.
They’re not lying.
Anthropic put Cognition FrontierCode up front — humans judging if they’d merge the model’s PR. Fable 5 hit 29.3%. Last gen was 5.2%. That’s a 5.6x jump on a hard, human-graded bar. OpenAI led with Agents’ Last Exam and the Artificial Analysis Coding Agent Index at 80 — 2.8 points over Fable 5 — and said Sol does it with half the tokens and half the wall-clock time at less than half the price.
Both claims can be true. They’re answering different questions. The gap between those questions — what each lab chose to headline — is the story.
The tell is in the table, not the headline
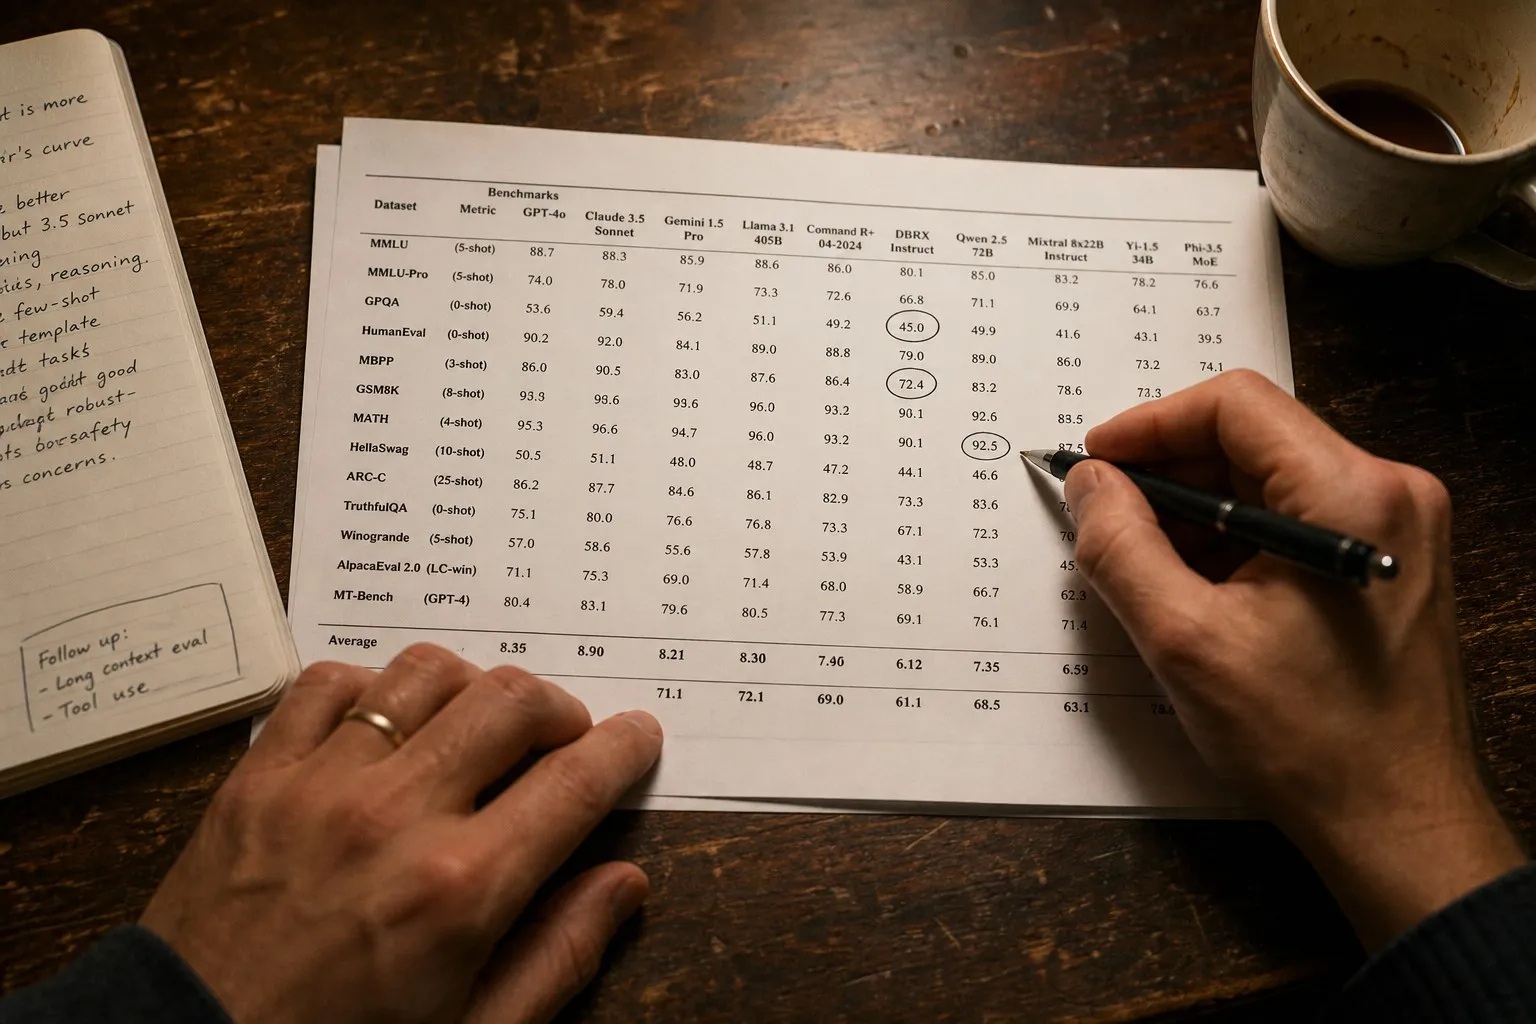
Here’s the habit: stop reading the headline, scan the cells where they’re losing.
OpenAI’s own table shows Fable 5 beating Sol on SWE-Bench Pro: 80.0% vs 64.6%. Toolathlon too: 61.7% vs 58.0%. OpenAI printed that. Translation: on long-horizon agentic coding, Anthropic’s ahead. OpenAI knows it and isn’t fighting there this quarter. They’re fighting on speed, price, and single-shot reasoning.
Anthropic runs the mirror play. They don’t lead with SWE-bench Verified (95.5% vs 95.0% — saturated and basically a tie). They lead with FrontierCode, where the gen-over-gen jump photographs like a moonshot. If the tiny SWE-bench edge mattered, they’d headline it. They didn’t. They picked the stage with the biggest delta.
Nobody’s cooking numbers. They’re choosing angles.
Stripe launches do this too: “6x faster settlement,” then the asterisk says “in the enterprise tier for these five card networks.” Not deceit. Selection. Your job is to notice the selection.
The axis quietly shifted from score to cost-per-score
Read the Sol pitch closely. It’s not “we beat them.” It’s “we match them at half the tokens, half the time, half the price.” Sol is $5 in / $30 out per million tokens. Fable 5 is $10 / $50. Terra is $2.50 / $15. Luna is $1 / $6.
If Sol truly matches Fable 5 on your workload at half the tokens and half the price, your inference bill drops ~4x. That’s not a leaderboard win. That’s a unit-economics win. That’s how you move a CFO.
Caveat: that “half the tokens, half the time” is still a vendor claim. There’s even a small mismatch in Sol’s own docs — 53.6 in the body, 52.7% in the table on the same metric. Maybe a typo. Maybe someone rushed. Either way, treat token-efficiency as a hypothesis to test on your workload, not a fact to accept.
Watch the pattern, not the press. When capability lags, vendors pitch cost. When cost lags, they pitch capability. When those are close, they grab a third axis — token efficiency, tool use, latency, refusal rate. The axis they choose is the one they think they can defend this quarter.
The benchmarks don’t measure what’s actually breaking
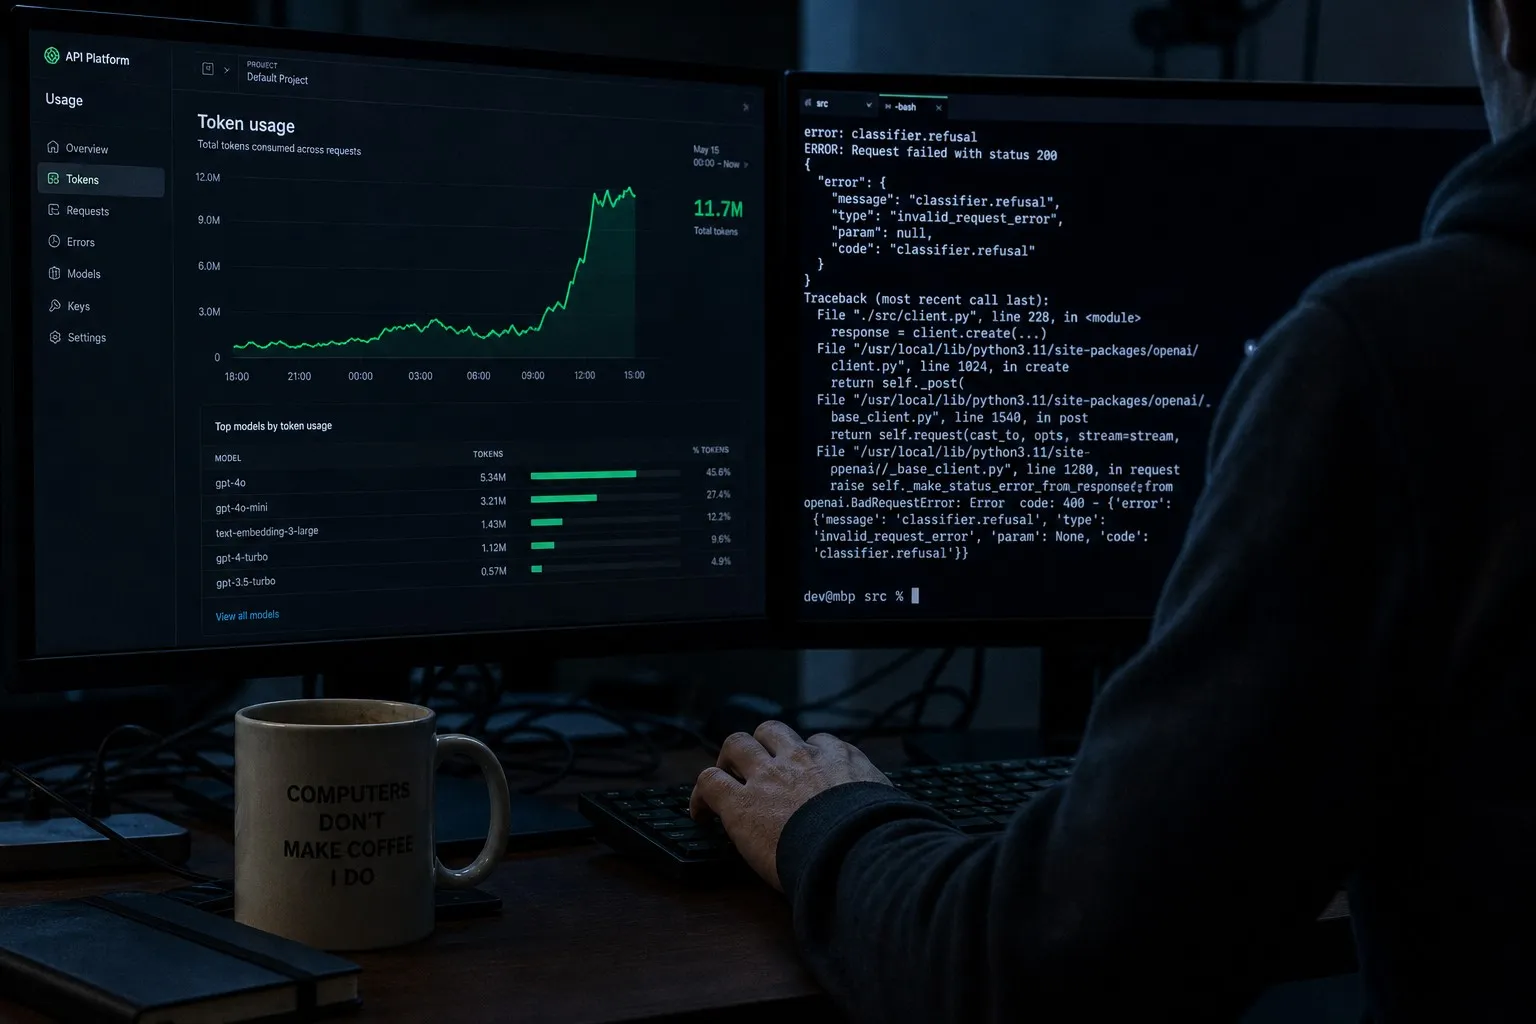
Look at what blew up the week Sol shipped. Not scores. Real teams:
- Five research agents in parallel burned the weekly token budget in an afternoon.
- A harmless refactor tripped the safety classifier.
- Terminal-Bench 2.1 says Sol is 88.8% and an Ultra mode is 91.9% — but that Ultra mode tripled the bill and added ship-blocking latency.
None of that shows up on SWE-bench. Or GPQA Diamond. Those measure single-turn capability on curated tasks. Production breaks on throughput economics, classifier false positives, and multi-agent token blowouts. Different axis. Different sport.
Independent testers are filling the gap. Nate Herk’s “I Tested GPT 5.6 Sol vs Fable 5” did 147K views in two days. Peter Yang’s “6 Real Use Cases” did 51K. Edward Donner’s “I Wasn’t Expecting This” landed the same week. Their frame is the one you should steal: ignore the vendor tables, run your actual workload, screen-record it.
That’s not punditry. That’s evaluation. And it’s the only benchmark that transfers to your product because it runs on your product.
What a real workload eval looks like
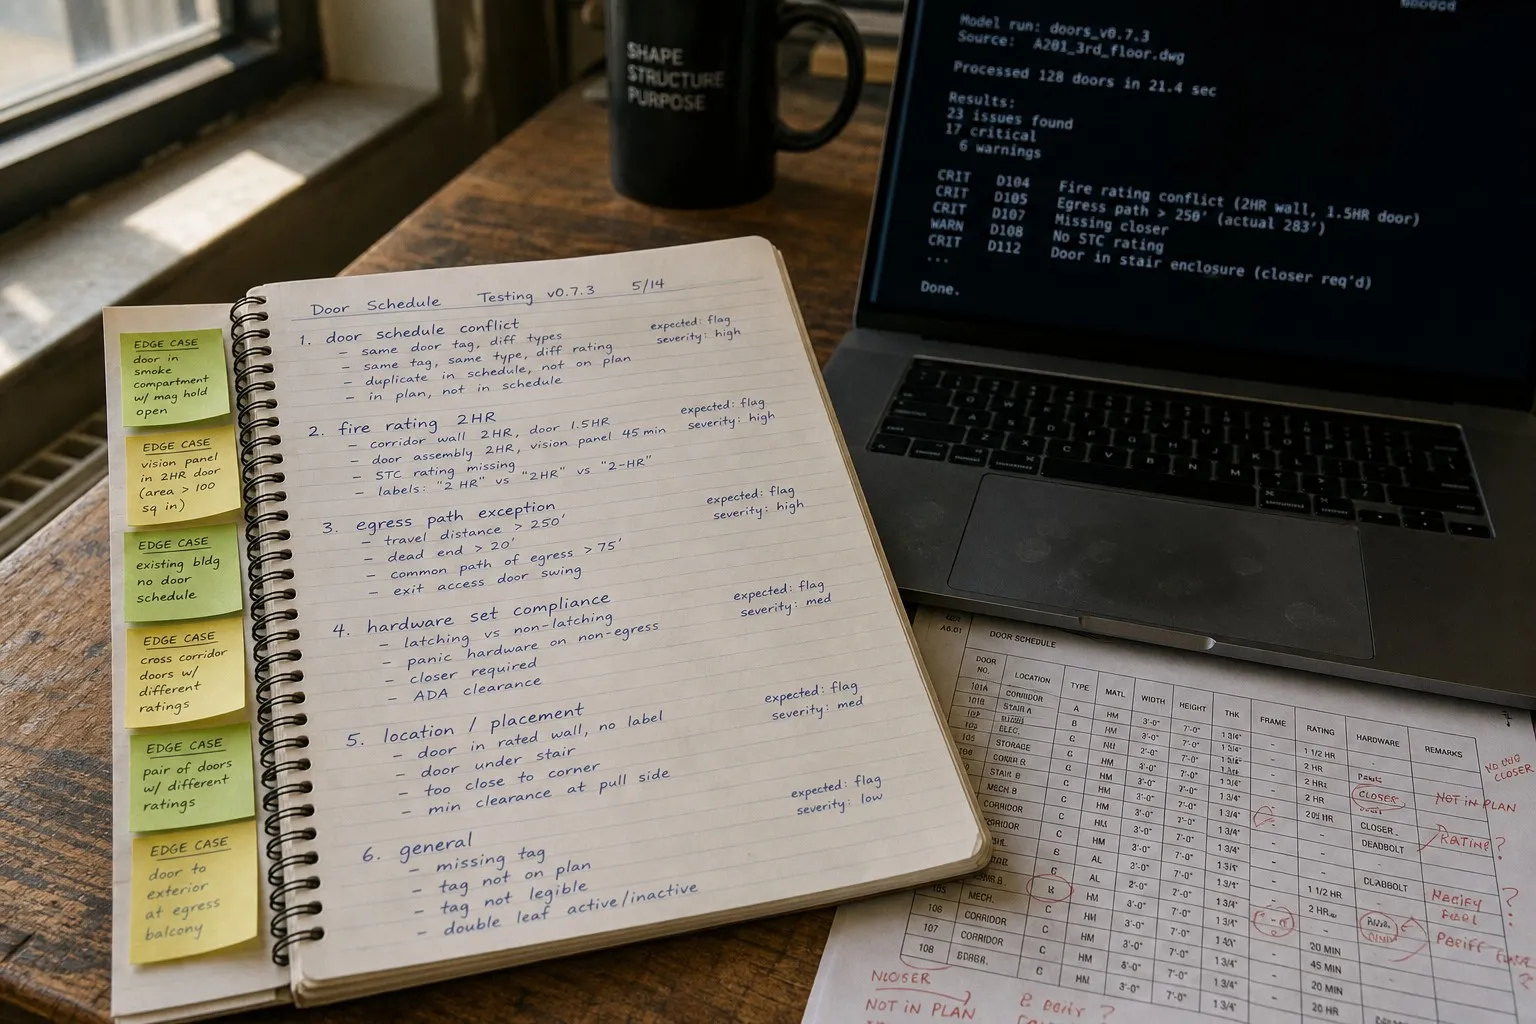
It’s not fancy. It’s 20–50 hand-picked examples from your traffic — the gnarly ones, the edge cases, the ones that triggered support tickets — with ground-truth answers you’ve verified. You run every candidate model on that set. You log accuracy, cost, latency, refusal rate. Then you do it again next quarter when the models change.
At my company we call it the golden set. For an AEC product, that looks like: pull the fire-rating spec from a CAD title block, cross-check the door schedule against wall-type callouts, flag the code-of-record conflict between two revisions. Build 20–30 of those, hand-label them, and nothing touches production until it clears that bar.
In fintech, it’s transaction categorization edge cases. In legal, it’s hostile-format clause extraction. The domain doesn’t matter. The discipline does.
Stripe Radar has run this play for a decade: internal evals on real fraud patterns, not public benchmarks. That’s why Radar works and generic LLM-as-judge fraud demos don’t.
The half-life of a vendor benchmark is one quarter
By October, a new model will drop. It’ll beat Fable 5 and Sol on the very tables they trumpeted in July. Pricing will move again. A fresh axis will show up — probably tool-use reliability or long-context retrieval.
None of that changes the only question that matters for your product: which model, at what price, at what latency, produces the fewest customer complaints on my workload?
You answer that with an eval you own. Not a launch post. Not a YouTube test. Not a leaderboard.
Do this this week: open a spreadsheet. Pull 20 of the hardest real requests from the last 30 days. Write the correct outputs. That’s your seed. Next week, run three models. The week after, ship the winner behind a feature flag and measure it in production for two weeks.
That routine — golden set, quarterly rerun, feature-flagged rollout — is worth more than every July benchmark table combined.
Vendors will keep publishing menus. Stop reading the menu. Start cooking.
(Next in this series: the risk that survives even a great eval — access, gating, and the cost of the classifier saying no.)